
What Makes a Good Chart
What Makes a Good Chart
Adam Kall, Director of Science
5 minute read
I’m a mathematician and as such, I don’t think there are enough conversations about graphs and charts. To me, a well-made chart can be an amazing way to convey a lot of information and associations in a short amount of time and a small amount of space. With the multifaceted aspects of orbital debris, KMI often uses charts to demonstrate massive amounts of information. The issue is in the abundance of very poorly made charts, which at best don’t convey much usable information and at worst purposefully mislead. Many articles have been written that go over examples of bad charts and why they are bad, but I’m going to focus on explaining ways to make charts more useful. When charts and graphs are made with knowledge of their general intent, it can help reveal better ways to display the most important information.
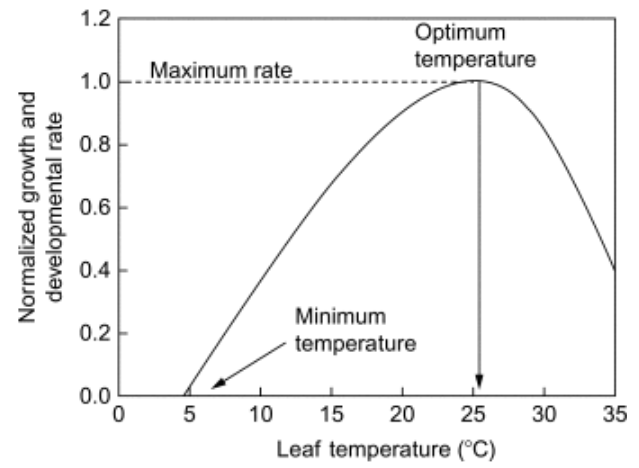
In general, the point of the horizontal axis, or x-axis, is to be the independent variable. A variable is independent when its value does not require other measured values to exist. For example, if you have a thermostat in your house the room temperature becomes an independent variable, as you can set the thermostat and it will achieve that value. The vertical axis, or y-axis, is to be the dependent variable, or the variable whose value depends on some other parameter and cannot be directly controlled. In the thermostat example, this could be something like the growth rate of a house plant or condensation on a window. Both of these elements can be measured, but there is no thermostat setting for “my aloe vera should grow faster.”
The point of a chart is that if the independent variable is set to some value, then the expectation is that there will be some correlated value of the dependent value that can be measured. If a line is drawn from the value on the x-axis and the resulting value on the y-axis, you can place a point and start making a scatter plot. Once multiple measurements are taken at different independent values, there will be a sufficient number of points to start looking for correlation. Correlation is a mutual connection between two things, so if a dependent value is correlated with an independent value, the controlled change in that independent variable will affect the dependent variable. It is very important to note that there has been no rigorous proof necessary to show causation at this point, meaning you can’t say that changing the independent variable will definitely cause a change in the dependent variable. This would be like seeing the below chart and assuming that more people get divorced in Maine directly because of more margarine being consumed in the U.S. I’m not saying that relation doesn’t exist, I’m stating that I haven’t performed the proper research to determine to what degree one affects the other. However, I can observe that these values appear to move together, which in some situations is enough to act on.

One place that uses charts in abundance is in the business world to display KPIs, or Key Performance Indicators. In some, that acronym may strike the fear of long meetings that try to justify why lines are moving down and not up. The intended use of KPIs is for high-level managers to get a quick overview of a team, project, or division. For this intent, having a single number showing real-time data that is green when above some level and red when below would be sufficient, but managers often want to see a timeline of how this value has been changing over time. This isn’t a terrible request, but suddenly there is a chart with time as the horizontal axis, which implies time is the independent variable. This is wrong, as we all know that we can’t control the time, and so it shouldn’t matter if the KPI was higher in March 2021 if it is currently June 2021, as we can’t turn back the clocks and make it March 2021 again. Yet on a daily basis analysts and supervisors sit in meetings where the boss sees a KPI chart going down and asks “Well, what’s happening here?” This is what I mean when I said charts often lack usable information. The below example looks exactly like what many high-level managers say they want to see, but I’m looking at eight different charts packed full of information and cannot even start trying to explain why Worldwide Accounts are down in mid-2018.

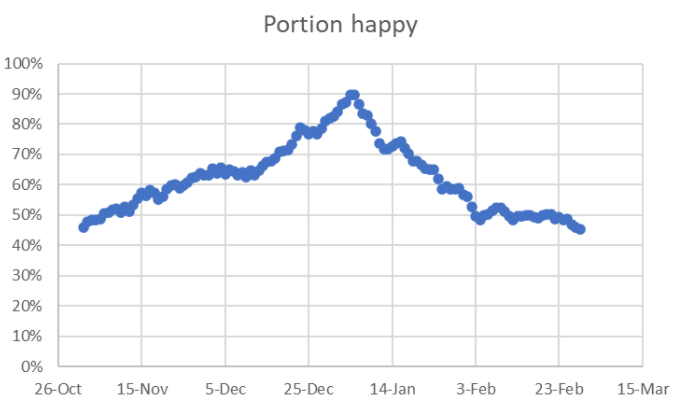
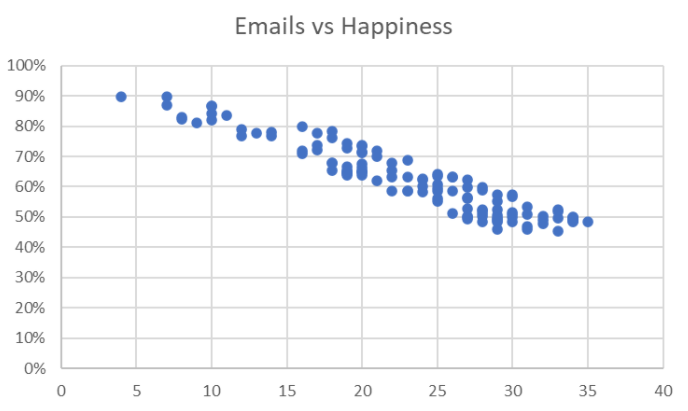
Instead of only measuring against time, KPIs should be measured against something the company can directly control. Since there are a plethora of things a business can directly change, it is up to the analysts and supervisors to select the variables they believe are most likely to cause changes in the dependent variable. One easy example would be a company trying to increase employee retention, so they try to measure employee happiness with a quick daily survey when they clock out. This could be as easy as a button they press if they enjoyed their day, and the result is a percentage of workers who enjoyed their day. The typical way this data would be viewed is on a time basis, and the result would show periods where employees are happier and periods where they are not. An excited analyst, trying to show their value and insight, might jump to the conclusion that employees are happier in November and December because of the holiday season and less happy in February because of the winter. However this is a gut feeling, and even if it was true the company can’t force a second Christmas in late February to boost morale. However, the company could look at a data point like the number of emails sent internally from the executive suite each day, as that is something the executives could directly influence, either sending more or fewer emails. In the example below, there is a clear negative correlation between the number of internal emails and employee happiness. This is not proof of causation, but for the company, they can easily run the experiment of decreasing internal emails. Even better, they can act like scientists by hypothesizing that if the executive suite decreases the number of internal emails sent daily to 15 or fewer, then they anticipate greater than 70% happiness among employees.
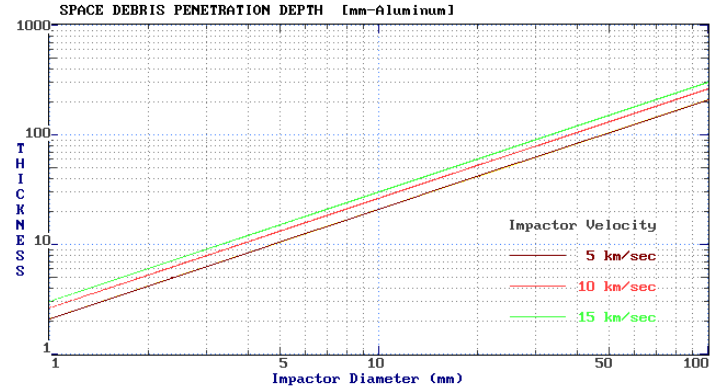
The 21st century is a time of big data, but many make the mistake of assuming big data directly equals big insights. It takes practiced and direct consideration of data in order to pull out actionable insights, but the end result can be one in which anybody viewing the chart can understand not only what has happened, but begin to grasp why it is happening as well. I’ll end this column with one final chart, showing the relationship of how much armor a spacecraft needs to survive impacts with various sizes of micro debris objects. Right now the number of debris objects is an x-axis that we have no control over, but through the efforts of KMI and other space companies invested in protecting the future of space, we can make the amount of debris a variable over which we have control.
Recommended column to read next: Hooking the Sky